We have recently been working on a system that requires short audio clips to be compared against a reference set of longer audio segments to determine if a match for the short clip exists in the reference set. In many applications, including ours, the short clip may have been recorded and processed — even compressed — prior to comparing it to the segments in the reference set. Many approaches for solving audio matching and related problems (including speaker and word recognition) rely on spectrograms for analysis. See, for example:
- http://labrosa.ee.columbia.edu/matlab/alignmidiwav/
- https://code.google.com/archive/p/py-astm/
- https://laplacian.wordpress.com/2009/01/10/how-shazam-works/
- https://ccrma.stanford.edu/~jos/st/Spectrograms.html
However, in this three-part blog series, I will not delve into the details of spectrogram matching. In fact, I want to do the opposite: I want to show how robust human audio perception is in the face of deliberate spectral distortions. In this context, robustness means our ability to recognize one clip as being a distorted version of another.
This post provides a very brief overview of the Discrete Fourier Transform (DFT), spectrograms and DFT spectral analysis, and it also introduces the audio waveforms I’ll be using in this series of posts. Part two will look at the effect of phase distortions on our ability to recognize a clip. Finally, part three will consider spectral magnitude distortions.
At the end of this series, I hope you’ll agree with me that:
- Dramatically different time-domain waveforms can lead to virtually the same audio perception;
- Two waveforms with identical spectrograms can sound quite different;
- Phase distortions generally have less effect on human perception than magnitude distortions; and
- Two audio clips can be recognized by humans as matching despite having dramatically different spectrograms.
You may have already encountered spectral analysis. The basic idea is to take a waveform, in our case an audio clip, and determine which frequency components are in it. Think of passing light through a prism and breaking it into a rainbow. The best-known tool for this sort of analysis is the Fourier Transform. For this series of posts, we’ll use the DFT for spectral analysis, the appropriate choice for sampled data. I’m going to provide a brief review of the DFT below, but if you want to dig deeper, I highly recommend this book.
The DFT transforms a vector of length N real-valued samples, such as audio samples, into a vector of Length N complex transform coefficients. The DFT transform is invertible so that the original audio samples can be obtained from the transform coefficients. To make this a bit more concrete, let
x(n)0<=n<=N-1
be N real-valued audio samples obtained at a sampling rate of Fs. The sampling period is therefore T=1/Fs. Let
X(k)0<=k<=N-1
be the N complex-valued DFT transform coefficients. The original audio samples can be uniquely reconstructed from the transform coefficients via the following formula:
x(n)=\frac{1}{N}\displaystyle\sum_{k=0}^{N-1}X(k)e^{i2\pi(\frac{kF_{s}}{N})nT}
Conceptually, what this formula is saying is: Each transform coefficient multiplies a complex exponential basis vector. Euler’s formula tells us that these complex exponential basis vectors are sinusoidal in nature. The weighted sum of all the basis vectors yields the original waveform.
The frequency of the k’th DFT basis vector is given by kFs/N. The FFT is a fast algorithm for computing the DFT transform coefficients. I wrote a previous blog series (part 1, part 2, part 3) on the use of transforms for image compression, and those posts also contain basic information about DFT-like transforms, emphasizing a matrix representation.
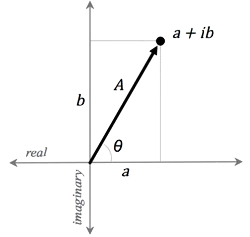
Now, a complex number, a + ib, can be graphed as a point in the two-dimensional plane with the real part on the “x-axis” and the imaginary part on the “y-axis”:

Thinking of complex numbers as two-dimensional points, it is clear that they can also be represented in polar form, where the magnitude and phase are given by
A=\sqrt{a^2+b^2}
I have chosen to write the inverse tangent in this form to emphasize that the phase can be any number between -π and π. A complex number can lie in any of the four quadrants of the plane, and the signs of a and b determine in which quadrant the phase lies. We also have the relationship
\theta=\tan^{-1}(a,b)
We can apply this to the inverse DFT formula as follows. Let
a+ib=Ae^{i\theta}
Each transform coefficient therefore has a magnitude and a phase. Substituting these terms into the expression for x(n) we have
x(n)=\frac{1}{N}\displaystyle\sum_{k=0}^{N-1}A_{k}e^{i}
We see that each transform coefficient changes the magnitude and shifts the phase of its corresponding complex exponential basis vector. In other words, the transform coefficients give us the magnitudes and phases of the sinusoids composing the vector of N audio samples.
So what is a spectrogram? Let’s assume that the audio clip has been sampled at 48 kHz. In its simplest form, a spectrogram can be created by:
- breaking the audio clip into a series of non-overlapping segments (vectors) of some constant length N;
- transforming each vector of samples into its corresponding DFT coefficients;
- creating a new vector from the transform vector by taking each coefficient’s magnitude;
- plotting the magnitudes in a 3D graph (each magnitude vector is one row in the graph).
One arrangement for the 3D graph is time along the y-axis, frequency along the x-axis, and magnitude along the z-axis. Using this convention, the spectrogram below illustrates a single 2 kHz sinusoidal tone. (Listen to this tone.)
![]()
In this spectrogram, time starts at the top and progresses downward. Think of the spectrogram as growing downward over time. Since only a single sinusoid is present, we see a thin straight line, indicating that only a single frequency is present as time progresses. The spectrogram is normalized so that, for each row in the picture, the largest magnitude DFT coefficient in that row is maximally white (i.e., it is 255 on an 8-bit scale). In terms of frequency, DC is on the left of the spectrograph, and the highest frequency is on the right. I used a DFT size of 4096. Since the sampling frequency is 48 kHz, the frequency increment between DFT basis vectors is 11.72 = 48,000/4,096 Hz. However, I only plotted the first 500 coefficients, so the highest frequency present—all the way on the right of the spectrograph—is 500 * 11.72 = 5,859 Hz.
The spectrogram below illustrates a clip with a sinusoid at 2 kHz for 1.5 seconds followed by a sinusoid at 3 kHz for 1.5 seconds. (Listen to this sample.)
![]()
The normalization of the spectrograph magnitudes is in dB. The highest power DFT coefficient present for a row is 0 dB, and the other coefficients in that row are displayed relative to the highest power coefficient. The display is linearly stretched so that a sinusoid 20 dB below the 0dB coefficient would be pure black (i.e., 0 on an 8-bit gray scale).
The spectrogram below illustrates five sinusoidal tones at different frequencies — all multiples of 500 Hz — with different amplitudes. (Listen to this sample.)
![]()
I’ll be using this particular waveform more in future posts.
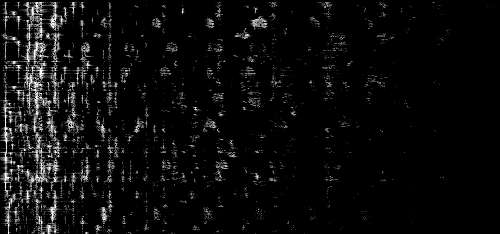
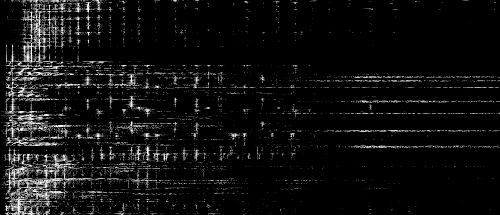
Finally, below are two spectrograms from actual music. The first spectrogram is for a short segment of the 1980s BBC Sherlock Holmes theme song, while the second is a song by Spock.
Holmes:

Spock:

Listen to these clips while looking at the spectrograms (Holmes, Spock). Can you see where the Spock song switches from music to voice? Can you see the violin’s vibrato in the Holmes song?
In part 2, how robust is audio perception in the face of deliberate magnitude and phase distortions, learn what happens to our ability to identify these clips if we intentionally distort the magnitudes and phases of the DFT coefficients from which the spectrograms are derived.
