Occasionally, while preparing for a streaming video design project, we need to measure the bitrate of a particular video stream on the network. Since I have found myself explaining somewhat regularly how to do this with Wireshark, I thought it might be worthwhile to post the instructions here.
In this example, I will show how to measure the data rate of a video streamed from Amazon.com. The same technique can be used to measure the rate of any network stream. And if you combine this approach with what I outlined in this post, you can measure the bitrate of a stream that is being consumed by an embedded device like an iPad or Blu-ray player.
Here’s what you do:
- Start Wireshark and set it to capture all traffic.
- Go to the application or website of interest, and start the video playing. Because the video is usually pretty bursty, you will want to average the measurement over an interesting period of time — at least a minute, and probably longer. In the screenshots below, I let my video play for 57 seconds.
- After capturing the video for a period of time, stop the Wireshark capture.
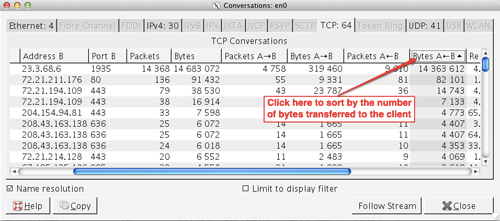
You probably captured quite a bit of data, so you need to narrow in to the particular TCP stream(s) in question. In Wireshark, select Statistics > Conversations, and then select the TCP tab. In my case, there were 64 different TCP streams captured during the one-minute Wireshark capture. Presumably, the stream we want is the one where the largest number of bytes were delivered, so to narrow in this stream, you’ll want to scroll to the right a little and sort the Conversations window by the column “Bytes A ←B”:Sure enough, one of the streams that we captured saw 14,363,612 bytes transferred from a server to our client. That’s probably the video. Doing a reverse hostname lookup on the server’s IP address gets this:
% host 23.3.68.6
6.68.3.23.in-addr.arpa domain name pointer a23-3-68-6.deploy.akamaitechnologies.com.
At this point, there are two ways to determine the bitrate of this particular stream.
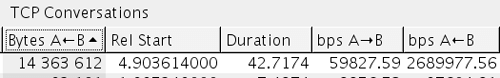
The first and easiest way is to scroll the Conversation window to the right. Wireshark is telling me that this particular stream lasted for 42.7 seconds and had an average bitrate of 2.689 Mbps:This is interesting for a couple of reasons. One: Wow, Amazon is delivering 2.6 Mbps of video to us — that seems really high! (Especially since the content in question was not particularly hard to compress or delivered at stunningly high quality.) Two: I watched roughly 57 seconds of video when performing this capture, but Wireshark is saying that the video was only moving across the network for roughly 43 seconds (the “Duration” column).
Both observations imply that the video was buffered. We know that the 14,363,612 bytes transferred in the capture contained at least enough video for 57 seconds of display. Dividing 14,363,612 by 57 seconds reduces the average bitrate to 2.015 Mbps — and this is a ceiling because there was probably some unplayed video left in our decoder’s buffer when I stopped the capture.
Understand Bitrate for Streaming Videos
Which brings us to the second and deeper way to understand the bitrate of a particular stream. To do this, you need to narrow the display filter so that only the TCP stream of interest is shown. The easiest way I know to do this is to select the stream in the Conversations window, and then click the “Follow Stream” button at the bottom. This will do two things: One, it will narrow the display filter in the main window to be exactly what we want. And two, it will bring up a “Follow TCP Stream” window that we don’t need for our purposes. So after clicking “Follow Stream,” you should close both the Follow TCP Stream window and also the Conversations window. You should be left with something that looks like this:
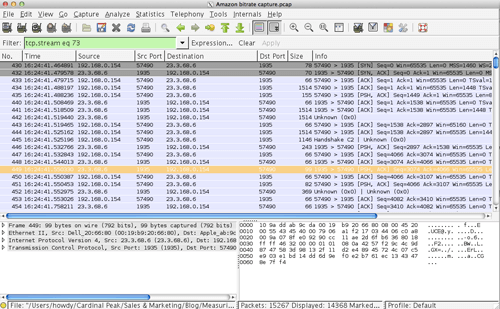
Note the display filter — in this case tcp.stream eq 73. That’s an internal Wireshark index. You could equally construct a rule with some AND and OR operators and the IP address and TCP port numbers, but this way we got Wireshark to figure that out for us.
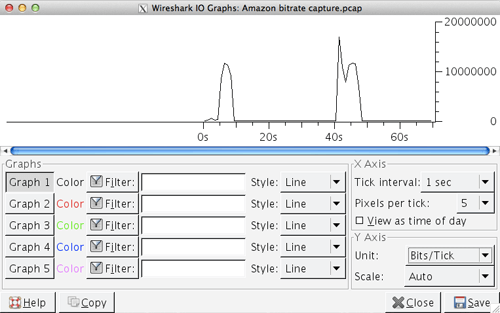
Now for the fun. Select Statistics > IO Graphs. Like most of Wireshark, the window that comes up is both very powerful and evidently designed by someone with no eye for user interfaces. To make the chart meaningful, you will want to set the Y Axis to “Bits/Tick,” as shown here:Here you can see when the data transited the network, and it’s awfully interesting. It looks like Amazon is pushing out quick bursts of data, and each burst contains at least 35 seconds worth of encoded video. That first hump in the graph bursts to over 10 Mbps, but since it contains video for at least 35 seconds, the underlying video is encoded at a rate no higher than 1.1 Mbps. Cool!
Learn more about Cardinal Peak’s video system design services and streaming media service development. Also, check out these related posts:
If you enjoyed this blog, subscribe to our quarterly newsletter below.