In my first post on ΔΣ converters I presented an intuitive way to derive the modulator portion of the converter. Now we need to look at what comes after the modulator — namely, the digital filter and the decimator. The high-level structure of the converter looks like this:

The analog input voltage, v(t), is assumed to be scaled so that its range is in the interval [-1, 1]. The output of the modulator is a sequence of uniform width pulses with a magnitude of either -1 or 1. These pulses are generated at an “oversampled” rate — in other words, at a rate greater than the Nyquist rate. The oversampling is by some significant factor, for example, 64. Let the highest frequency present in the signal be B; the Nyquist rate is then 2B, and the output rate of the modulator for an oversampling factor of 64 is 128B.
We wish to reduce the sample rate to the Nyquist rate while extracting the signal v(t) from the pulses. We do this by lowpass filtering the pulse train to a bandwidth of B and then sampling the filter’s output at the rate 2B. Consider a FIR LPF filter. Because the pulse sequence only has 1s and -1s in it, the FIR filter can be implemented with additions and subtractions only. Furthermore, although the 1s and -1s are shifted into the filter at the oversampled rate, the filter’s output only needs to be computed at the Nyquist rate, which is nice from a computational perspective because we only need to compute the samples we’re going to keep!
To make this all clear, let’s trace the flow of a simple input signal through the system in both the time and frequency domain. For this example, I’ll let B be 4KHz, which corresponds to telephone quality audio. Let’s assume an oversampling factor of 64. Then pulses are output from the modulator at the rate 2 × 4000 × 64 = 512 kilobits/sec (bearing in mind that we convert the sequence of -1s and 1s into an equivalent sequence of 0s and 1s, so each pulse is captured as a single bit). As an input signal we’ll use the sum of two cosines, one at the low end of the pass band and one at the high end (730 Hz and 3.765 KHz respectively). Both cosines have the same amplitude, 0.5, so their sum is within the [-1,1] range required. The input signal looks like this:
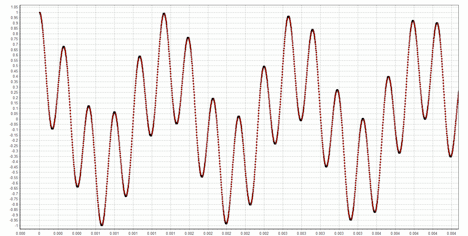
The spectrum of this signal computed over a 4-second interval is shown below. Here the x-axis is in kHz and the y-axis is in dB relative to the highest power frequency in the signal.
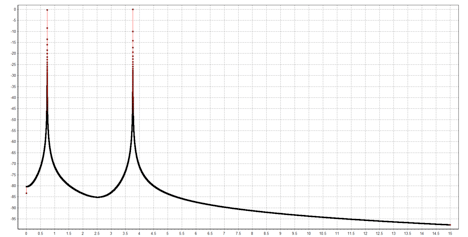
As expected, the input signal has two well-defined peaks.
The sequence of pulses output from the ΔΣ modulator when this signal is input looks like this:
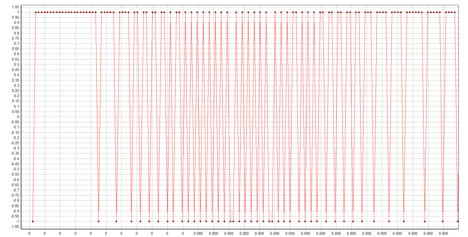
In intervals where the input signal is large, many 1s are output, while in intervals where the input signal is close to zero, 1s and -1s occur with a nearly equal frequency. Since we propose to recover the input signal by lowpass filtering this pulse stream, it is interesting to look at the spectrum of the pulse stream. In the range of 0 to 15 kHz, it looks like this:
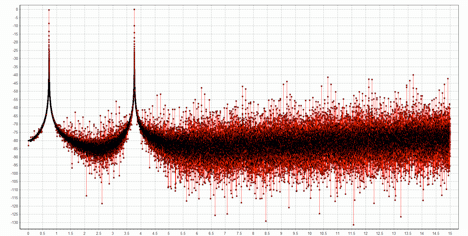
The original signal spectrum is clearly visible, but there is lots of noise above 4 kHz. In fact, if we plot all the way out to 256 kHz (1/2 the oversampled rate of 512 kHz), we see the following:
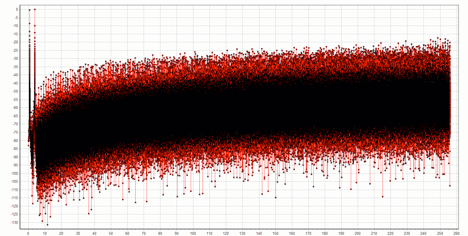
The 1-bit sampling has introduced a huge amount of quantization noise, and it increases with frequency. Were we to subsample the signal at an 8 kHz rate without first lowpass filtering, all of this noise would alias into the 4 kHz band we care about! To do the lowpass filtering, I used a 1000-tap FIR filter in my simulation; I wanted to show the effect of a very good filter. After filtering, the spectrum looks like this:
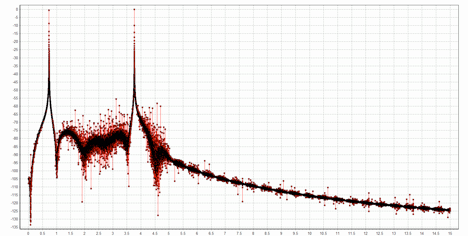
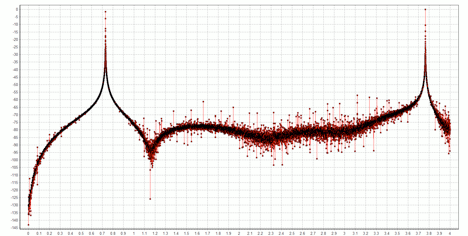
Most of the out-of-band quantization noise has now been eliminated. After subsampling the signal by a factor of 64, we are down to the Nyquist rate. Any quantization noise remaining after the LPF has now been aliased into our frequency band of interest. The spectrum of the Nyquist sampled signal over the range 0 to 4 kHz is shown below; the two cosine signals have been converted with very little distortion.
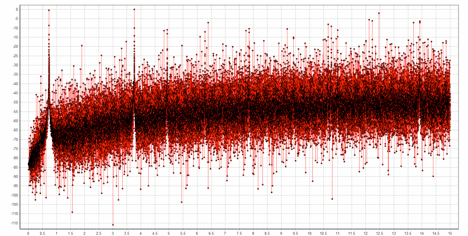
As a final note, it’s worth showing the spectrum of the modulator’s output pulse train when the oversampling factor is only 4 instead of 64. As seen below (the graph covers the range 0 to 15 kHz), there is a lot more in-band noise (i.e., in the range 0 – 4 kHz) than occurs with 64x oversampling. Not surprisingly, higher sampling rates lead to better performance!
Here is the code I used for these simulations.
Mike Perkins, Ph.D., is a managing partner of Cardinal Peak and an expert in algorithm development for video and signal processing applications.
